
Topic 13: IDEs, Debugging and Understanding Errors#
Introduction#
We have previously developed and run Python either from text files and command line, or in Jupyter notebooks. While both approaches work quite well for short scripts, it quickly becomes inconvenient when writing scripts with more than a couple of hundred lines of code or when a program is being organized in several separate code files. For developing these larger projects the best tool is Integrated Development Environments (IDEs).
In this section, we will familiarize ourselves with Visual Studio Code (VS Code) - an IDE developed by Microsoft. We will first cover the installation and then explore some of the code editing, execution, and debugging features of VS Code. We will finish by having a closer look at Python errors and what useful information they contain.
Preliminary Guide: Installing Visual Studio Code (VS Code)#
Visual Studio Code is a free, versatile IDE ideal for Python development. Follow these steps to install VS Code on both Windows and Mac.
For Windows#
Download VS Code:
Open your web browser and navigate to https://code.visualstudio.com/.
Click the Download for Windows button.
Run the Installer:
Once the download completes, run the installer (a
.exefile).Follow the on-screen instructions:
Accept the license agreement.
Choose the installation location.
Optionally, select additional tasks (e.g., add VS Code to your PATH or create a desktop icon).
Complete Installation and Launch:
Click Install and wait for the process to finish.
Launch VS Code from the Start menu or desktop shortcut.
(Optional) Update VS Code by selecting Help > Check for Updates after installation.
For Mac#
Download VS Code:
Open your web browser and go to https://code.visualstudio.com/.
Click the Download for Mac button.
Note: For Apple Silicon (M1/M2) Macs, the appropriate version is automatically selected.
Install VS Code:
Once the download is complete, open the downloaded
.zipfile to extract the application.Drag the Visual Studio Code app into your Applications folder.
Launch and Configure:
Open VS Code from the Applications folder or via Spotlight search (
Cmd+Spacethen type “Visual Studio Code”).To enable command-line usage, open VS Code, press
Cmd+Shift+P, and run Shell Command: Install ‘code’ command in PATH.
Final Checks#
Verify the installation by checking the version in Help > About.
For Python development, install the official Python extension:
Open the Extensions view (
Ctrl+Shift+Xon Windows orCmd+Shift+Xon Mac).Search for Python and click Install.
Part 1: VS Code integrated development environment#
Task 1#
Launch VS Code. In the File menu, click Open Folder… and navigate to the topic folder.
In the main window now click New File and when asked for the filename, enter
test.pyWrite the now familiar code in the main window (see below):
print('Hello world!')
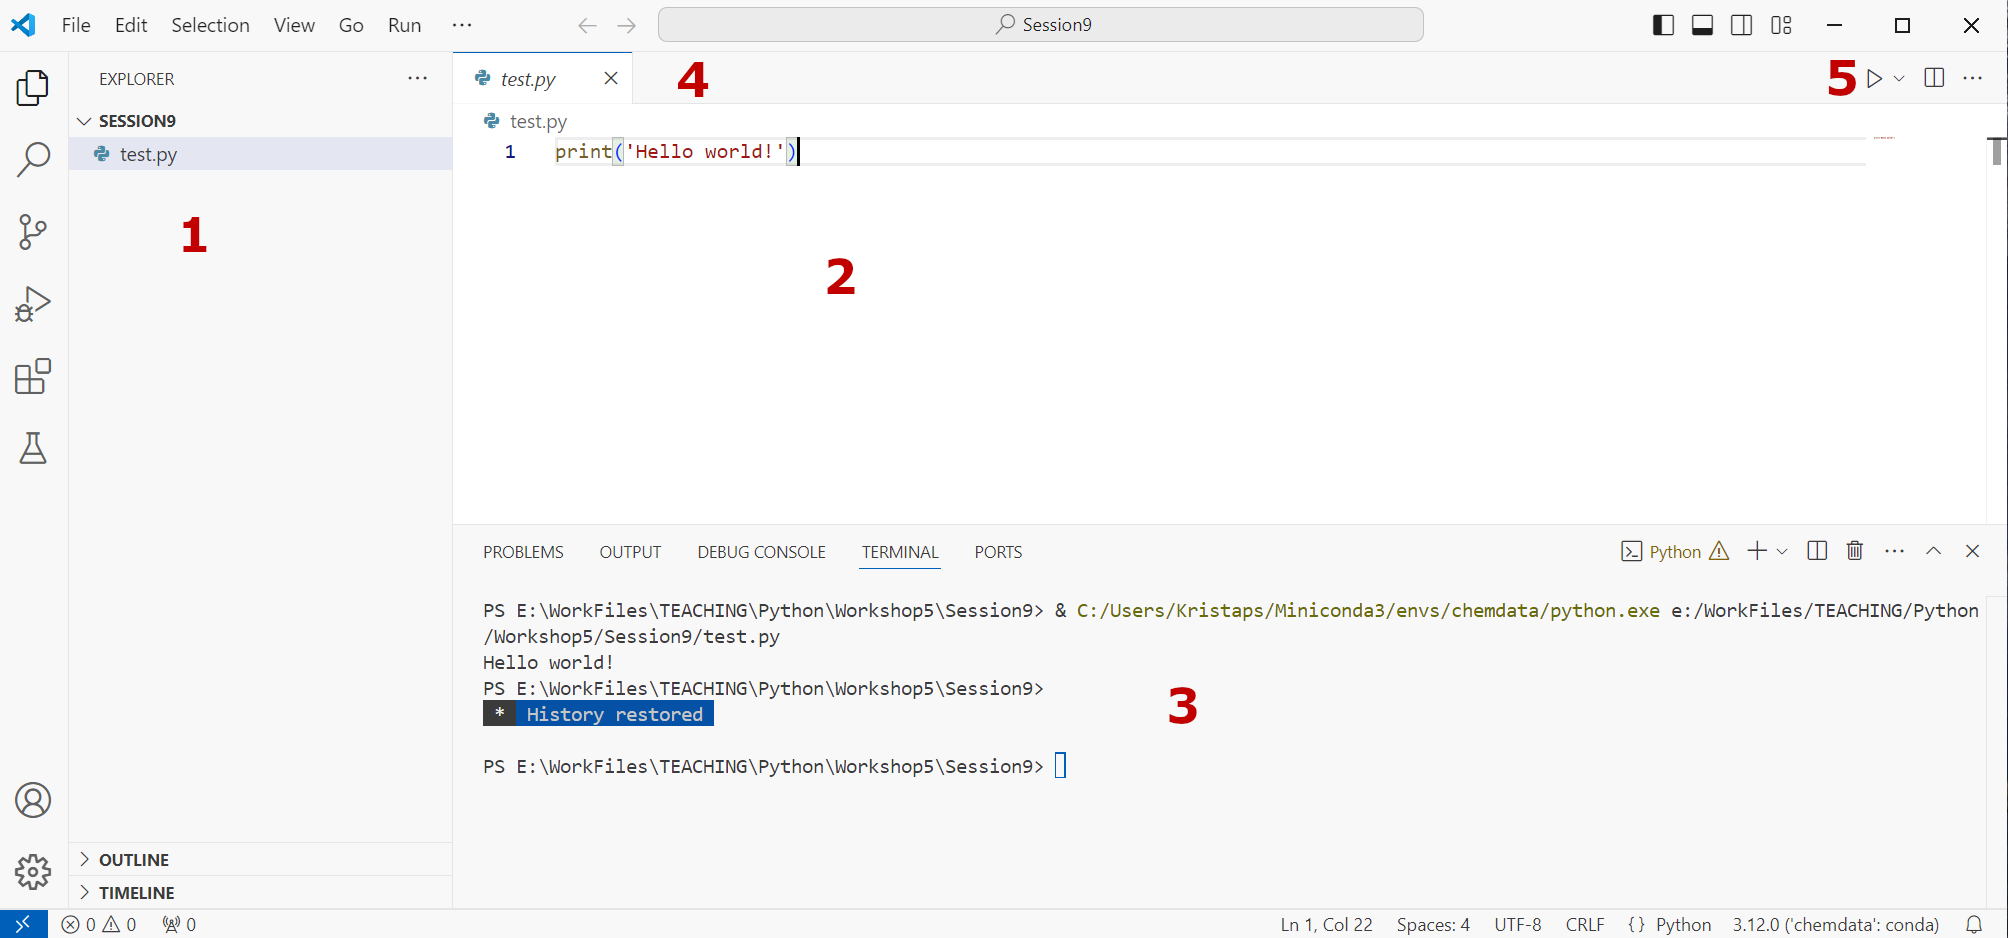
You should see a window that looks like the one above. Let’s understand what we are seeing:
This is the folder view, showing all files in the current folder. It allows for easy opening of various files relevant for your project.
This is the main code editor window, which works as any other text editor.
This is the Python console - serving the same function as a command line for executing Python scripts.
Here you will see tabs for each code file you have open, similar to internet browser tabs.
This ‘Play’ button will execute current script. Press it now - you should see the output of your code in the bottom window (3).
Task 2#
In the main window now click New File and when asked for the filename, enter
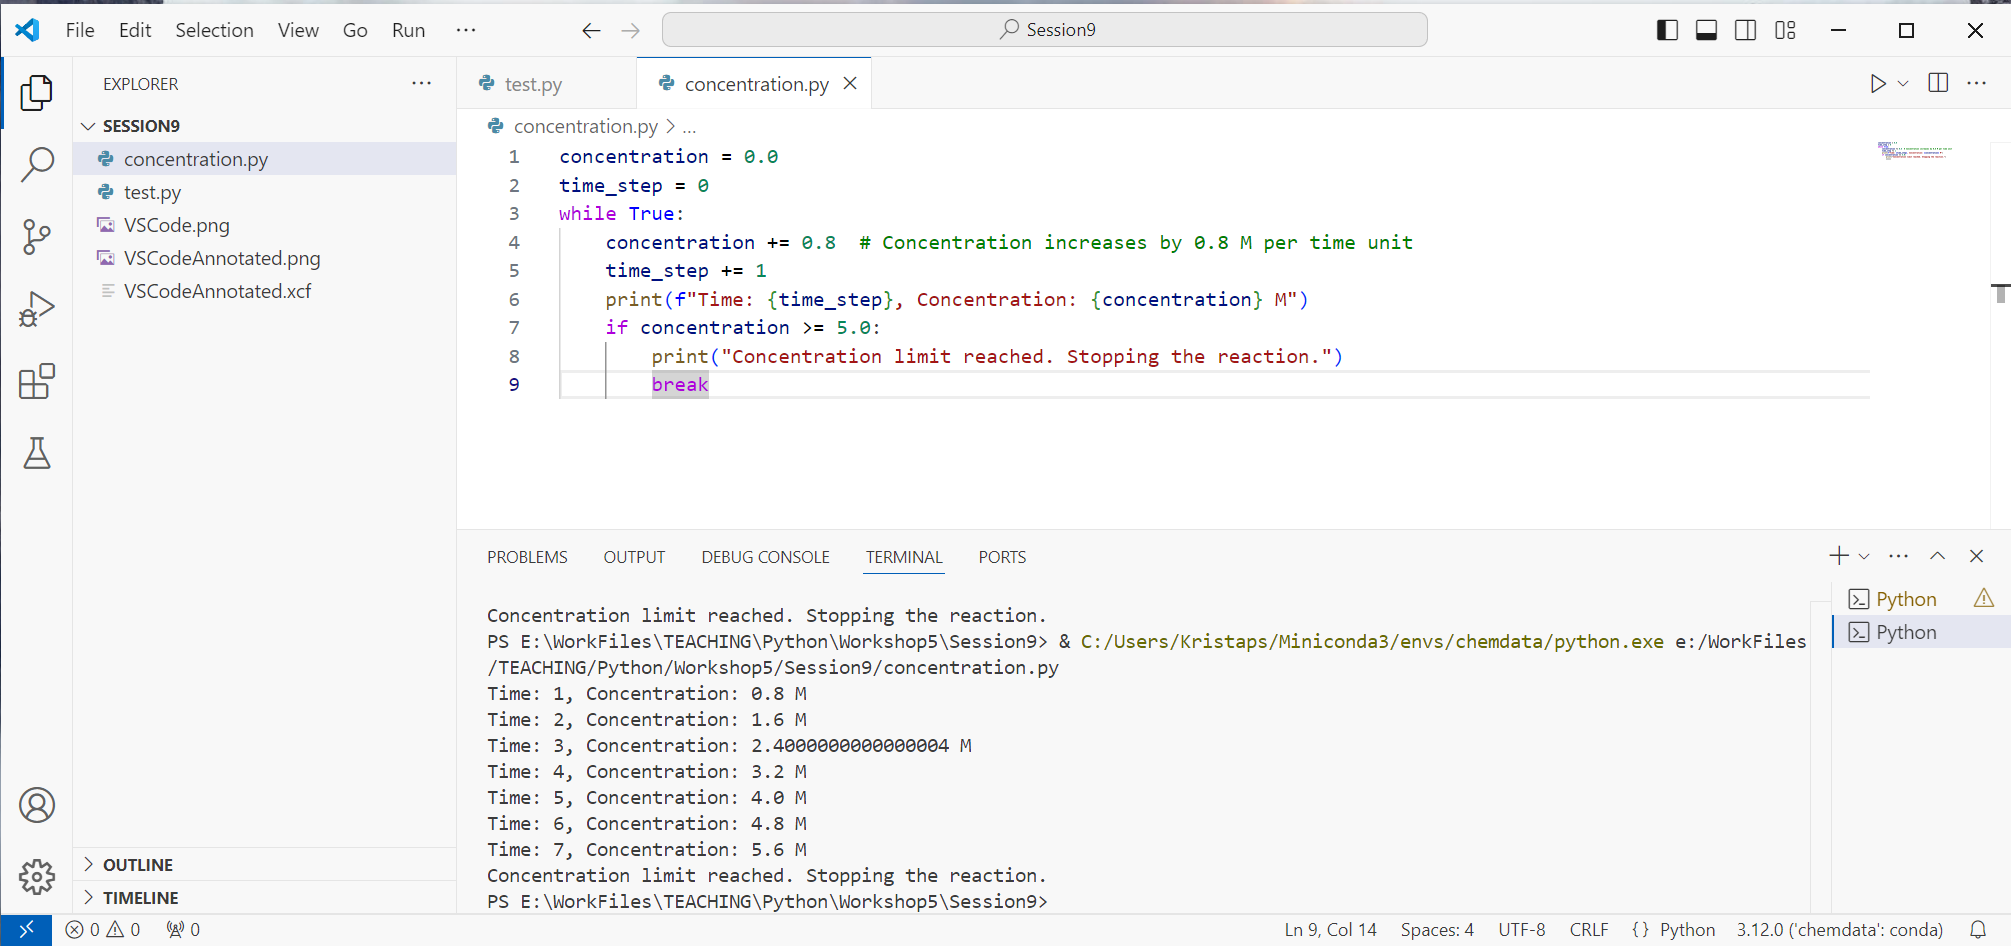
concentration.pyCopy the code from previous session in the main window (see below):
concentration = 0.0
time_step = 0
while True:
    concentration += 0.8  # Concentration increases by 0.8 M per time unit
    time_step += 1
    print(f"Time: {time_step}, Concentration: {concentration} M")
    if concentration >= 5.0:
        print("Concentration limit reached. Stopping the reaction.")
        break
Save the file (
ctrl + sor File -> Save)Run the file by pressing the Run button on the top right.
You should see something like this:
Now let’s try using some of the debugging features of VS Code.
Part 2: Introduction to Debugging in VS Code#
Debugging is an essential part of programming that involves identifying and fixing errors or bugs in your code. VS Code provides powerful debugging tools that help you understand how your program executes and why it might not be working as expected.
You can find the latest documentation on debugging Python in VS Code here: https://code.visualstudio.com/docs/python/debugging
Task 3: Understanding Breakpoints and Step Execution#
Setting Up the Code:
Open your
concentration.pyfile from Task 2.We’ll use this code to explore debugging features.
Setting a Breakpoint:
Click to the left of the line number where you want the program to pause.
You should see a little faded red/pink dot appear under your mouse pointer, turning red on click. This sets a breakpoint - a point in program where the debugger will stop running the program and wait for further instructions from you.
Breakpoints can be cleared by clicking on them again.
Set a breakpoint on the line:
concentration += 0.8 # Concentration increases by 0.8 M per time unit
A red dot should appear next to the line number.
Starting the Debugger:
On the side menu, select the ‘Run and Debug’ option (Play icon with a bug) and then ‘Run and Debug’
Alternatively, press
F5on your keyboard.If prompted, select “Python File” as the debug configuration.
Note
Newer versions of VS Code may have a slightly different interface; refer to the documentation for the most up-to-date information
Using the Debugger:
The program will run and pause at the breakpoint you set.
You’ll see the debugging toolbar appear at the top, which allows you to control execution.
VS Code should automatically switch to the “Run and Debug” sidebar to the left, but in case it hasnt you can select it by clicking the icon on the left containing the a play and bug (insect) icon.
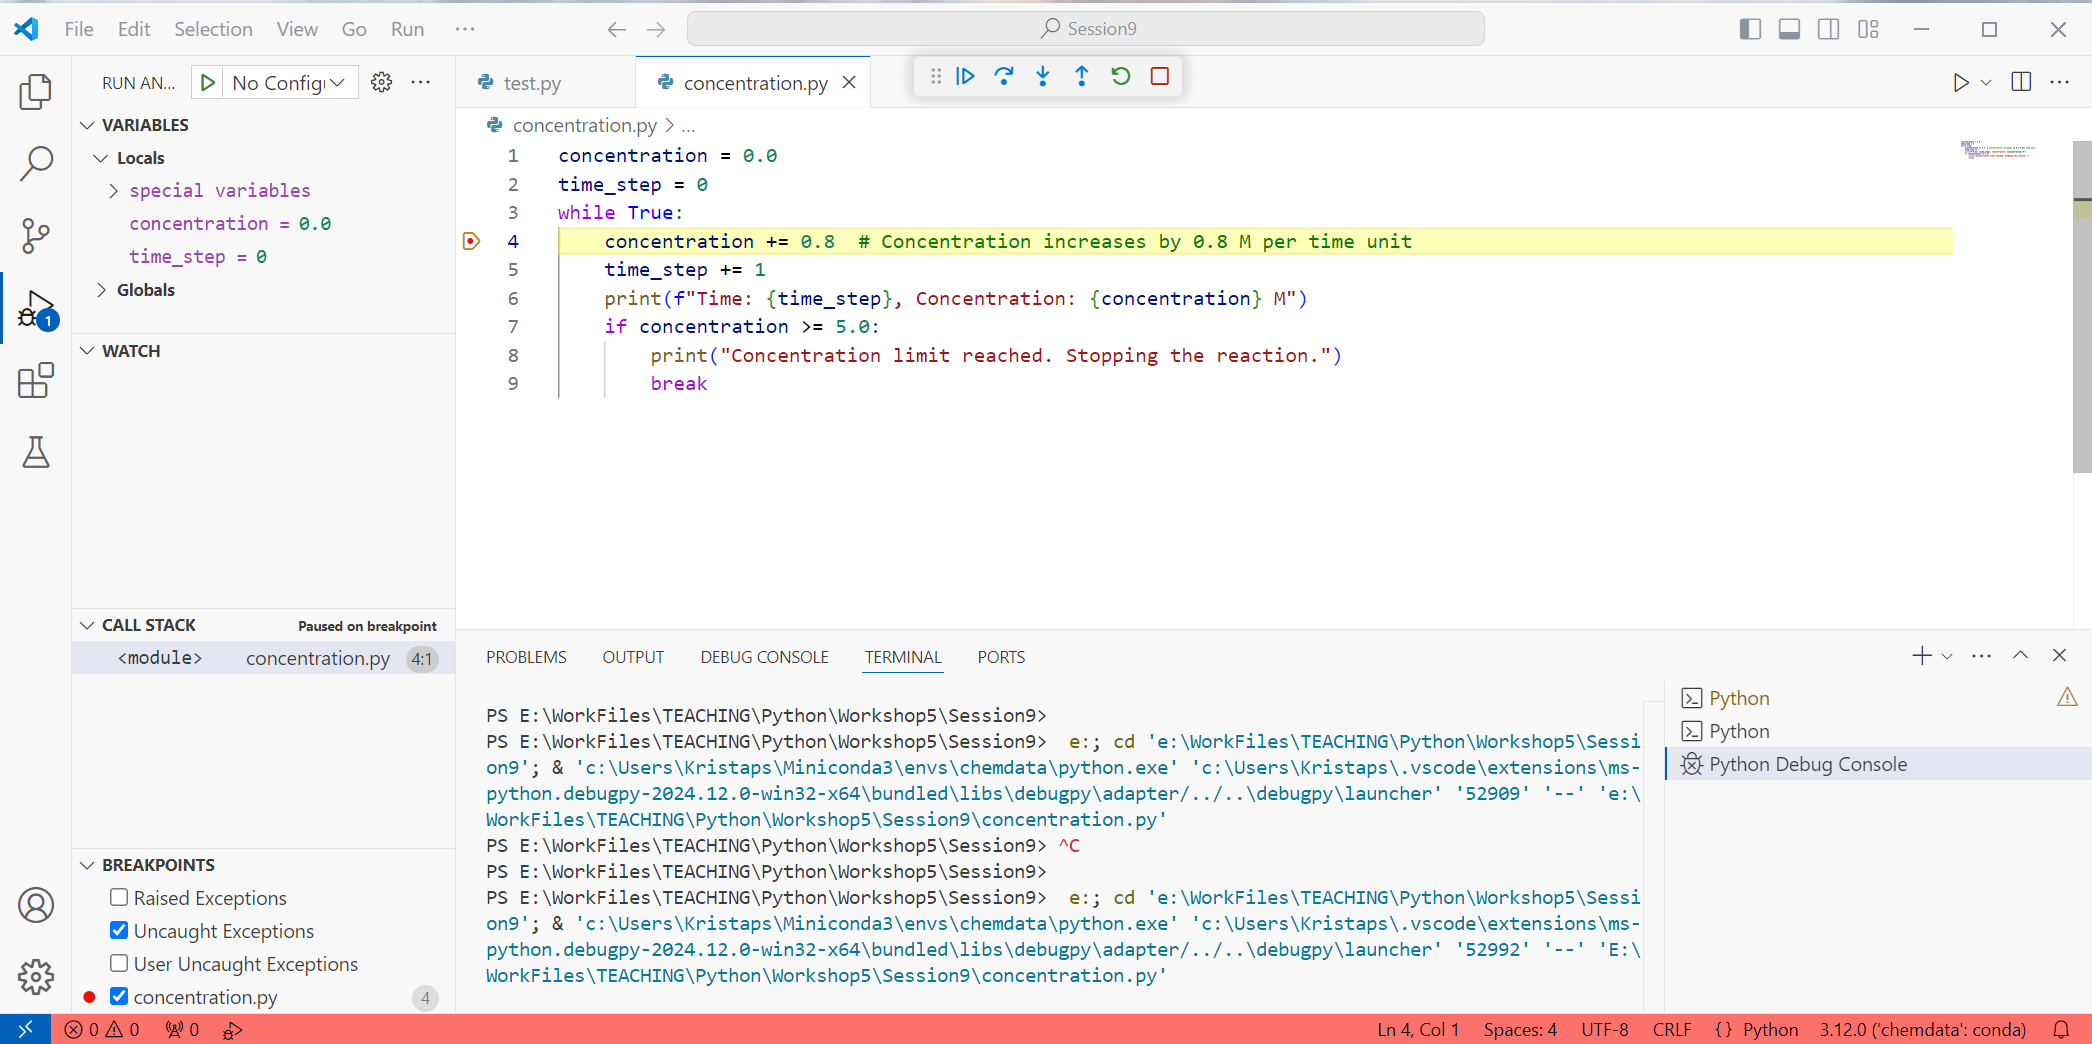
Examining Variables:
Look at the ‘VARIABLES’ pane on the left (make sure you have the “Run and Debug” sidebar selected!).
You can see the current values of variables like
concentrationandtime_step.You can also hover your mouse over variables in the code itself and it will tell you their value in a popup (if it has been declared and assigned)
Stepping Through the Code:
Use the ‘Step Over’ button (curved arrow) to execute the next line.
The ‘Step Into’ button will follow any functions or modules we might be using, while ‘Step Over’ will go to the next line without digging deeper.
Feel free to play around with these buttons as you debug your own code later to get a better understanding of their differences.
Observe how variable values change after each step.
Continuing Execution:
Press the ‘Continue’ button (play icon) to resume normal execution until the next breakpoint or the end of the program.
Stopping the Debugger:
Click the ‘Stop’ button (square icon) to end the debugging session. This will normally stop the program from continuing as well.
Task 4: Identifying and Fixing a Bug#
Create a New File:
In VS Code, create a new file named
reaction_rate.py.
Copy the Code:
reactant_amount = 50  # grams
threshold = 5         # grams

time = 0
while reactant_amount < threshold:
    reactant_amount = reactant_amount * 0.85  # Decrease by 15%
    time += 1
    print(f"After {time} cycle(s), reactant amount: {reactant_amount:.2f} grams")
Save it and run it by pressing the ‘Play’ button on the right. What is the apparent problem with this program?
Now try using debugging to understand the problem better. Set a breakpoint in this line:
time = 0
then continue execution step by step.
When you have found the issue, try to fix it. Verify it by running the program with and without debugging.
Part 3: Understanding Python Error Messages#
Errors, or exceptions, occur when Python encounters something it can’t handle. Understanding these error messages is key to debugging.
Task 5: Exploring Common Error Types#
Introduce an Error:
In VS Code, create a new file named
reaction_rate2.py.
Copy the Code:
# Example reaction: A + B → Products, rate = k[A][B]
rate_constant = 0.02  # s⁻¹·M⁻¹
concentrations = {'A': 0.5, 'B': 0.3}  # Concentrations in Molarity

for concentration in concentrations:
    rate = rate_constant * concentration
    print(f"The reaction rate is {rate} M/s")
Examine the error message:
File "e:\Python\IDEs\reaction_rate2.py", line 6, in <module>
    rate = rate_constant * concentration
        ~~~~~~~~~~~~~^~~~~~~~~~~~~~
TypeError: can't multiply sequence by non-int of type 'float'
Analysis#
Explanation:
Traceback: Shows the sequence of “calls” leading to the error (not shown above).
File “reaction_rate2.py”, line 6, in <module>: The error occurred in this file (including the full path) and in this line.
You can ignore the <module> bit for now.
rate = rate_constant * concentration: The exact line where the error happened.
TypeError: Indicates the type of error with a succinct explanation.
Error Message Details: - “TypeError: can’t multiply sequence by non-int of type ‘float’.”: Cannot multiply a floating point number (
rate_constant) by a string (concentration)Understanding the Cause:
This may seem somewhat surprising - we were not intending to multiply anything by a string! The issue is that we are using incorrect iteration over dictionary entries. Iterating over dictionary entries returns keys (
'A', 'B'), not the values (0.5, 0.3)Since
concentrationis a string ('A'or'B'), multiplication with a float is invalid.
Fixing the Error:
Use
concentrations.values()to get numerical values. The for loop should start like this:for concentration in concentrations.values():
Common Python Error Types#
SyntaxError: Issues with the syntax of your code (e.g., missing colon, unmatched parentheses).
NameError: Using a variable or function name that hasn’t been defined.
TypeError: Applying an operation to an object of inappropriate type (e.g., adding a string to an integer).
ValueError: Function receives an argument of the correct type but inappropriate value.
IndexError: Trying to access an index that is out of range in a sequence.
KeyError: Attempting to access a dictionary key that doesn’t exist.
IndentationError: Incorrect indentation, which is critical in Python.
Tips for Reading Error Messages#
Start from the Bottom:
The last line of the error message often tells you what went wrong.
Look at the Traceback:
Follow the call stack to see where the error originated.
Check the Line Number:
The error message indicates the file and line number where the error occurred.
Understand the Error Type:
Knowing what a
TypeErrororNameErrormeans can help you quickly identify the issue.
Use Debugging Tools:
Set breakpoints and inspect variables to understand the program’s state at the point of error.
Conclusion#
In this section, we’ve explored how to use Visual Studio Code (VS Code) as an Integrated Development Environment (IDE) for Python programming, focusing on its debugging capabilities and understanding Python error messages.
VS Code Features:
Code Editing: Write and edit your code with syntax highlighting and code completion.
Execution: Run your scripts directly within VS Code.
Debugging: Set breakpoints, step through code, and inspect variables.
Debugging Techniques:
Breakpoints: Pause execution to examine the state of your program.
Step Execution: Execute code line by line to observe the flow.
Variable Inspection: Check the values of variables at different points.
Understanding Errors:
Error Messages: Read and interpret error messages to identify issues.
Common Errors: Be familiar with common Python errors and their causes.
Tracebacks: Use tracebacks to locate where errors occur in your code.
By mastering these tools and techniques, you can efficiently identify and fix bugs in your programs, leading to more reliable and robust code. Remember that debugging is a normal part of programming; even experienced developers spend time debugging, as almost no code is completely correct the first time around!